
What's On My Plate?
Analyzing what we eat depending on where we live
Analyzing what we eat depending on where we live
Open Food Facts is a food products database maintained by thousands of volunteers worlwide. The dataset
contains information about more than 600,000 products worldwide, going from general information
such as the manufacturing country to more specific data such as the ingredients contained. This dataset
contains enough information to be able to investigate several characteristics of the food industry.
We aim to examine the eco-friendliness, origin and nutrition score of the products in order
to analyze what we eat depending on where we live.
An initial look at the dataset showed us that there are approximately 699,000 rows (one per product) and 173 columns representing different information that exist for a specific product. While this may seem like a very large number of information, it also contains a high number of missing values (NaN). An example is shown in the following figure, where the percentage of values that are not missing for some columns is shown:
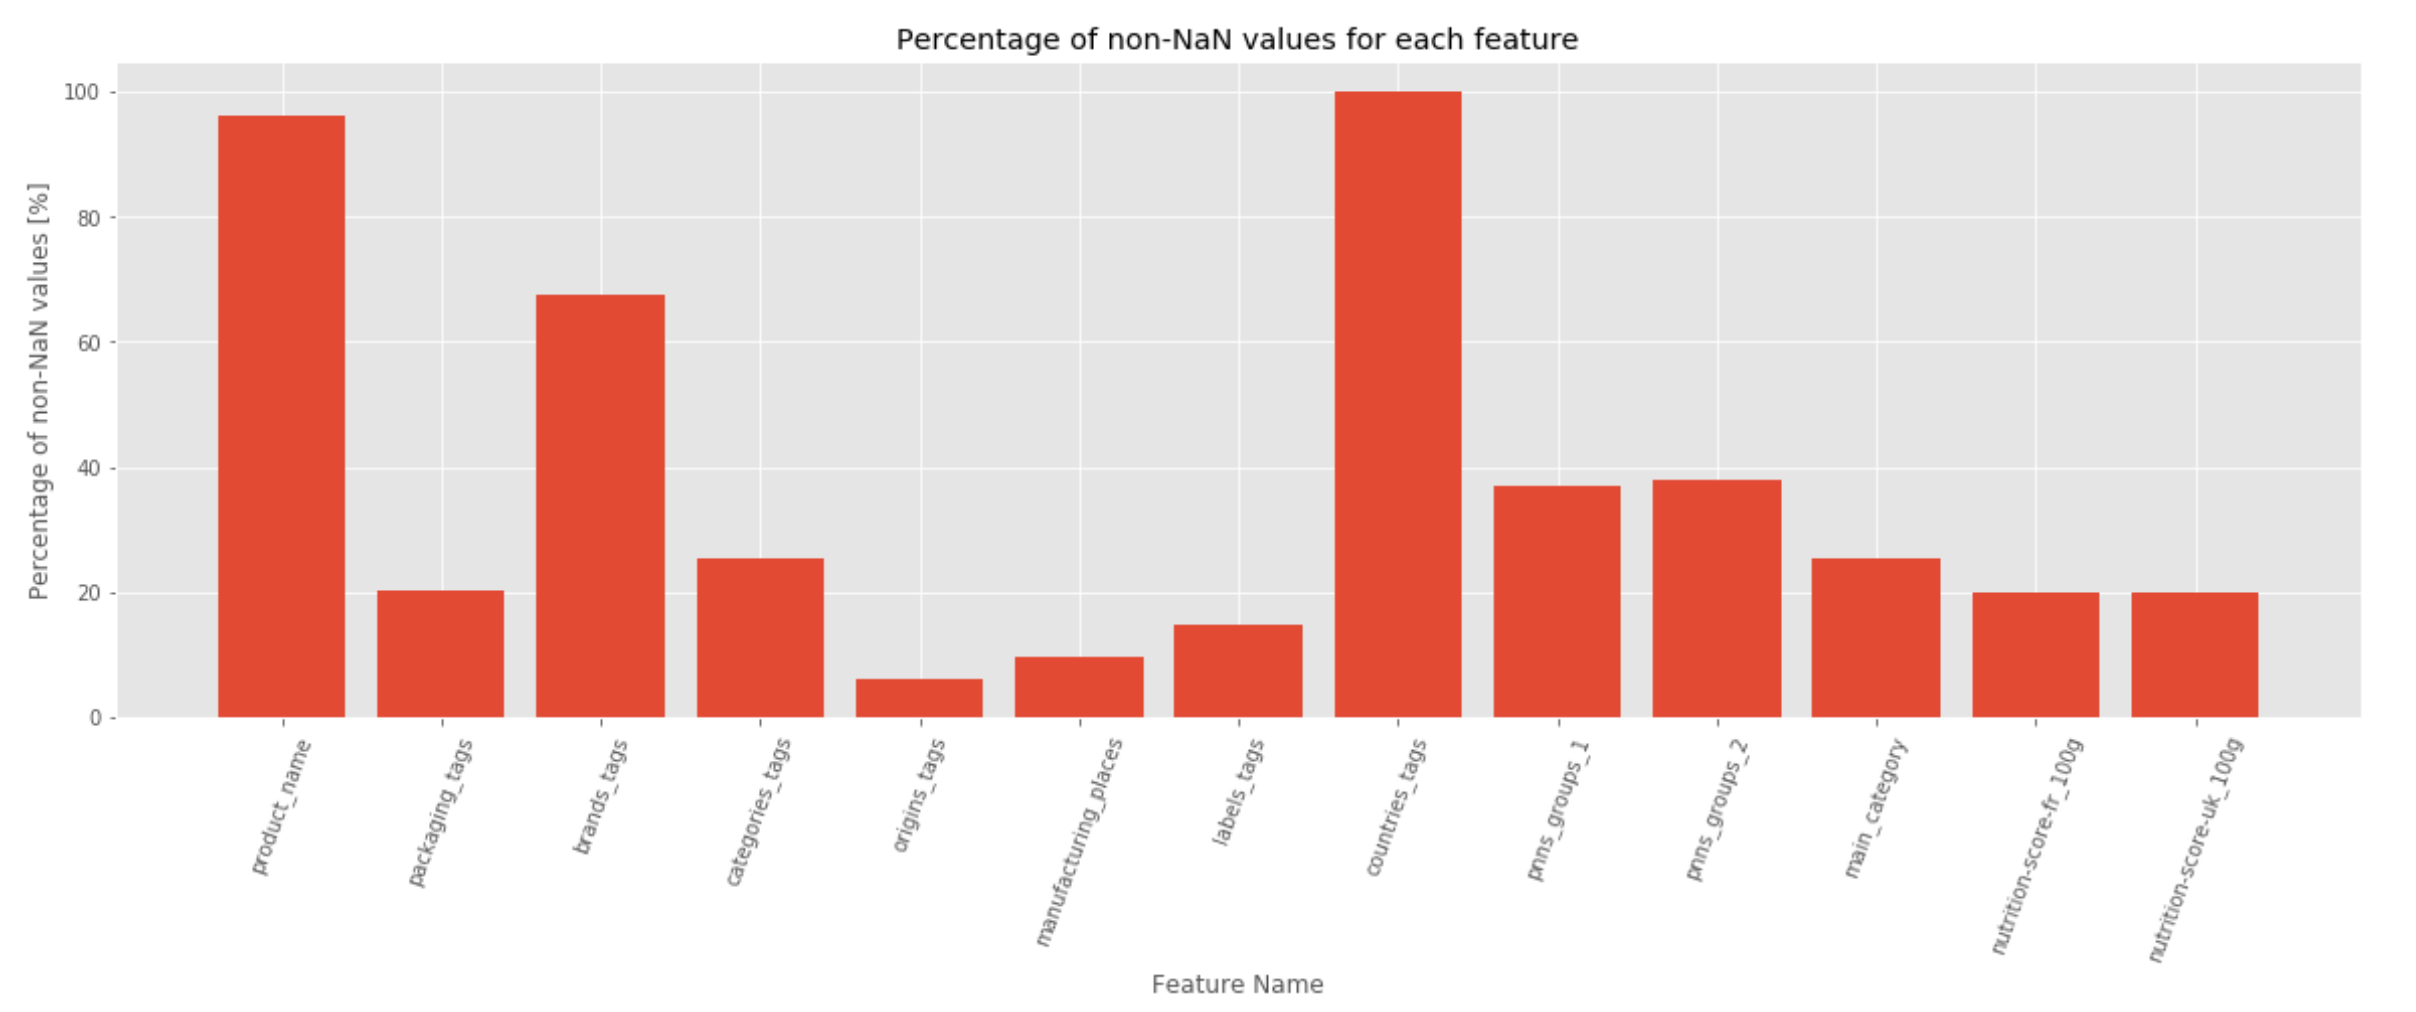
We notice that some features such as manufacturing_places have mostly missing data and could therefore jeopardize the depth of our research.
This problem is not specific to only one column, but is the case for more features.
However, since our research questions are mainly centered around the topics of nutrition score, eco-friendliness and countries,
we were able to remove 160 features making the dataset more lightweight and easier to analyze. For example,
the column containing the URL for the product image is not relevant to our research. Additionally,
some columns were very similar. An example is shown in the following image:
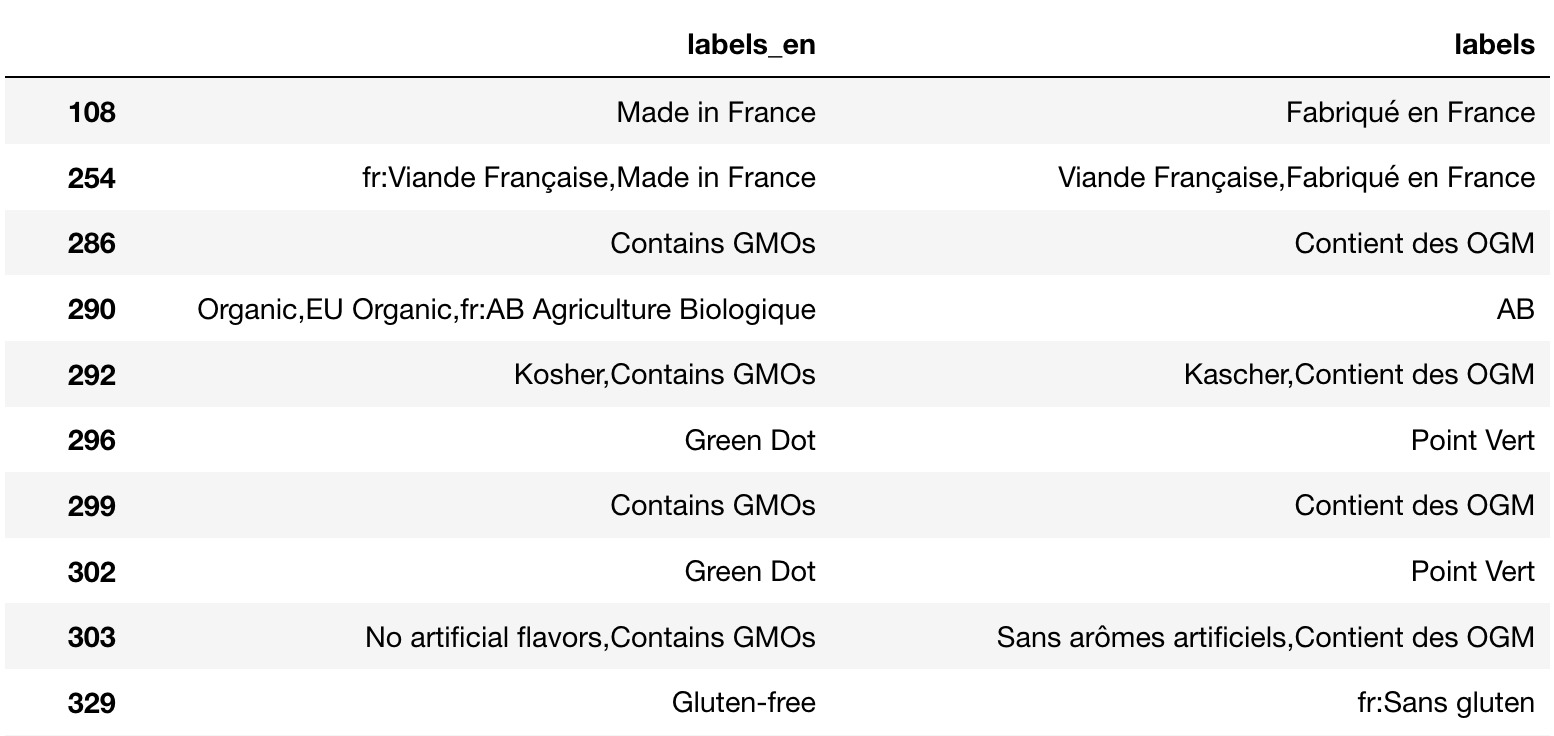
In this situation, we have manually looked at the columns to select the ones that have more consistent values, i.e.
values in the same language and without typos. After removing all these columns along with the ones that not needed,
we were left with only 13 features in total.
One of the most fundamental aspects of our research relies on countries . More specifically,
this dataset separates countries in two categories: those where the product is sold and those where the product is originated from.
The columns related to the countries where products are sold have nearly no missing values, which is extremely helpful for our analysis.
However, it has very inconsistent and messy values. More specifically, some countries are written in different
languages and/or different ways such as "Frankreich" and "Frankrike" both representing the country of France.
On top of this issue, values not representing countries were part of this feature such as "European union"
or even "Global market" . Hence, this topic has resulted in heavy data cleaning in order to have correct and consistent country names.
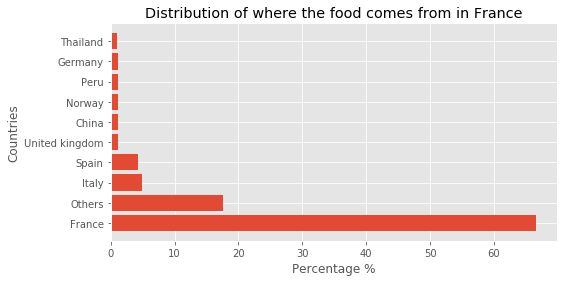
After successfully cleaning the data, we have looked at the distribution of the top 10 countries in the dataset to have an idea about
the location where the products in this dataset are mainly sold.
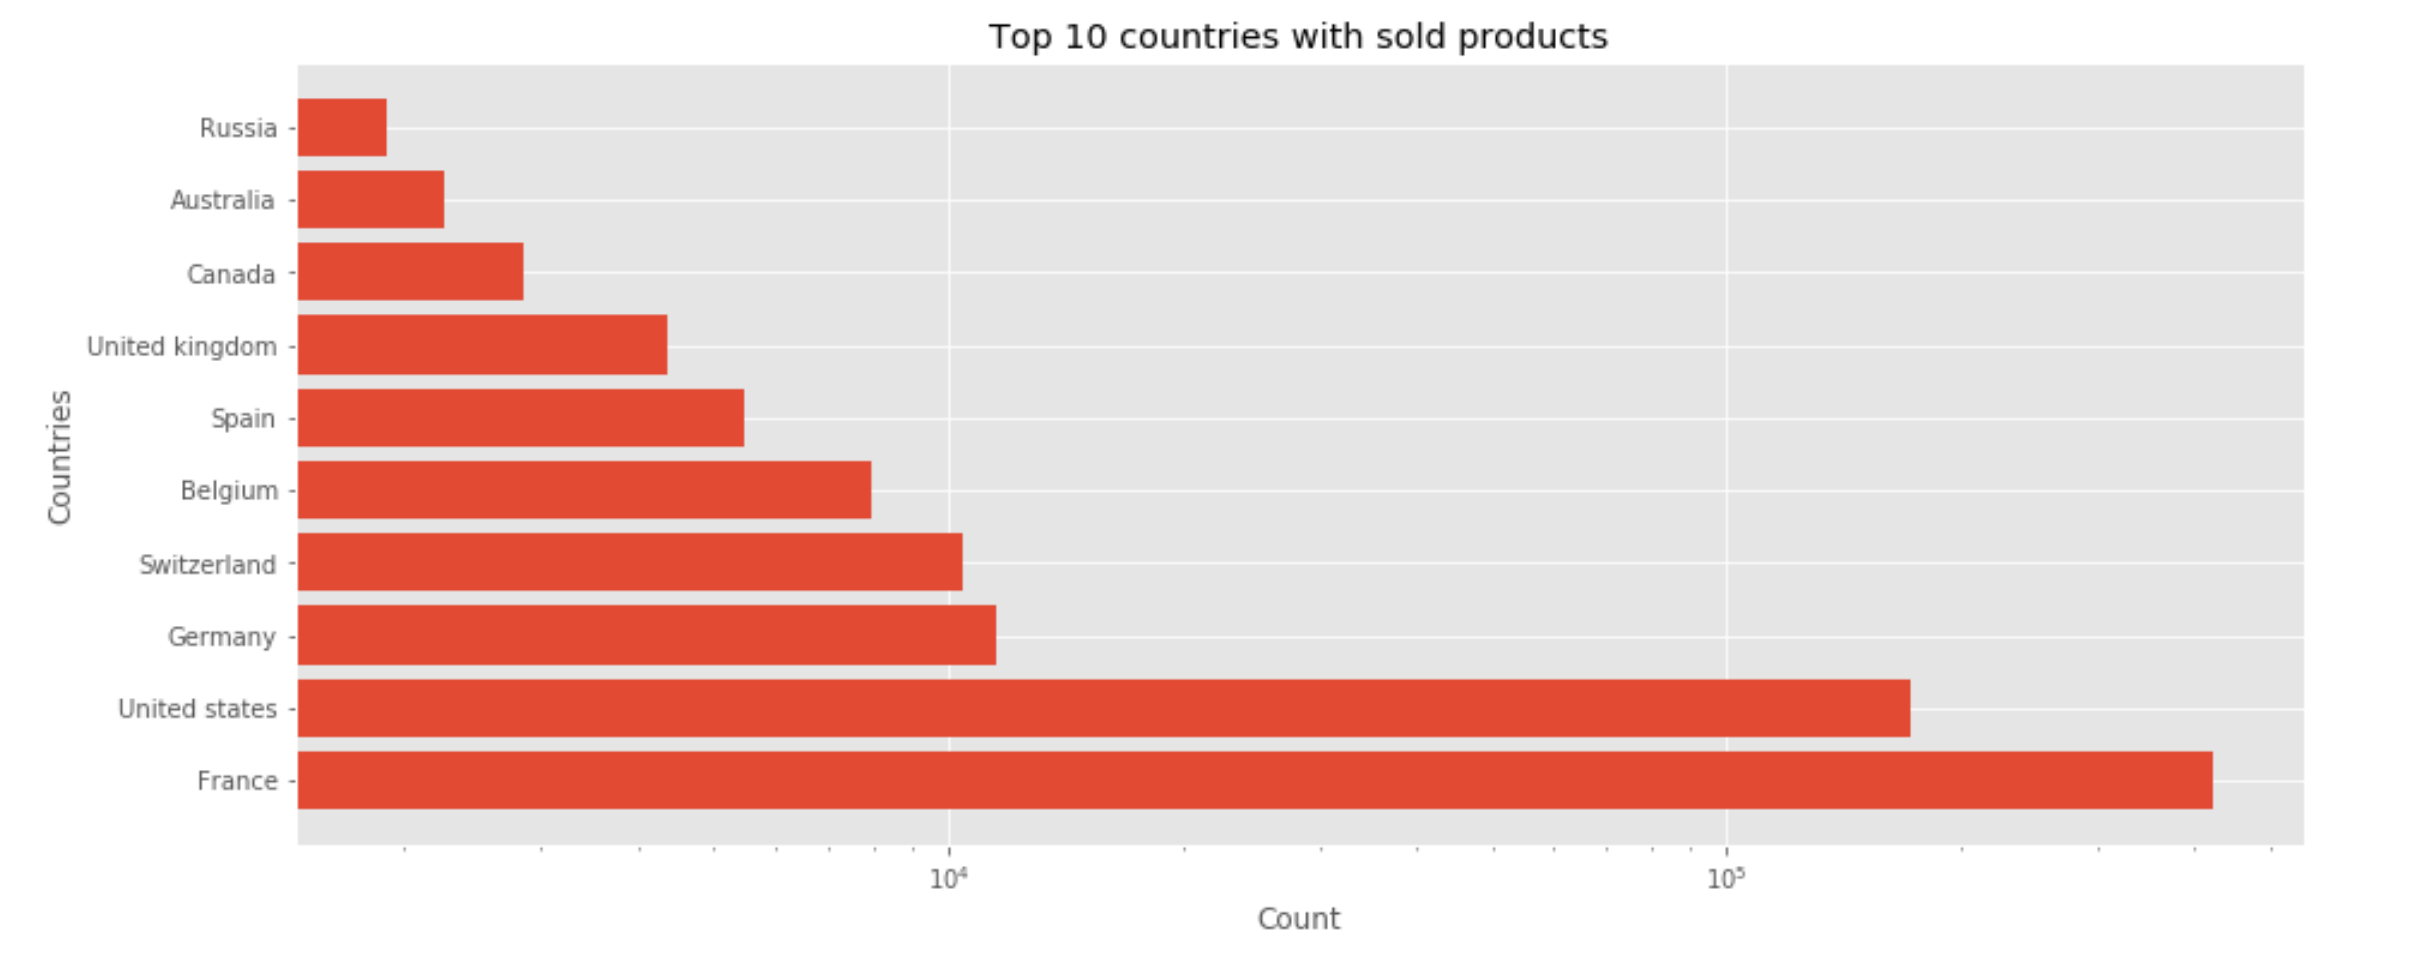
We notice that France has by far the largest number of elements in the dataset, with over 60% of the total products
in the dataset, followed by the United States. In fact, these two countries alone represent 85% of countries where the products
are sold in the dataset.
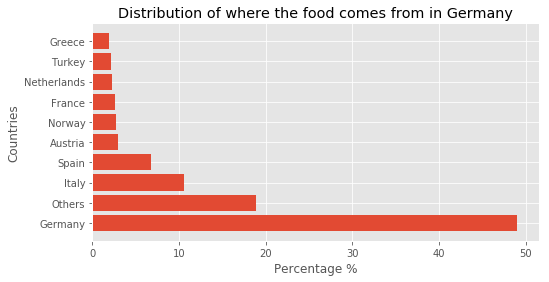
We have also examined the distribution of the countries where products mostly come from (their origins), resulting in the following:
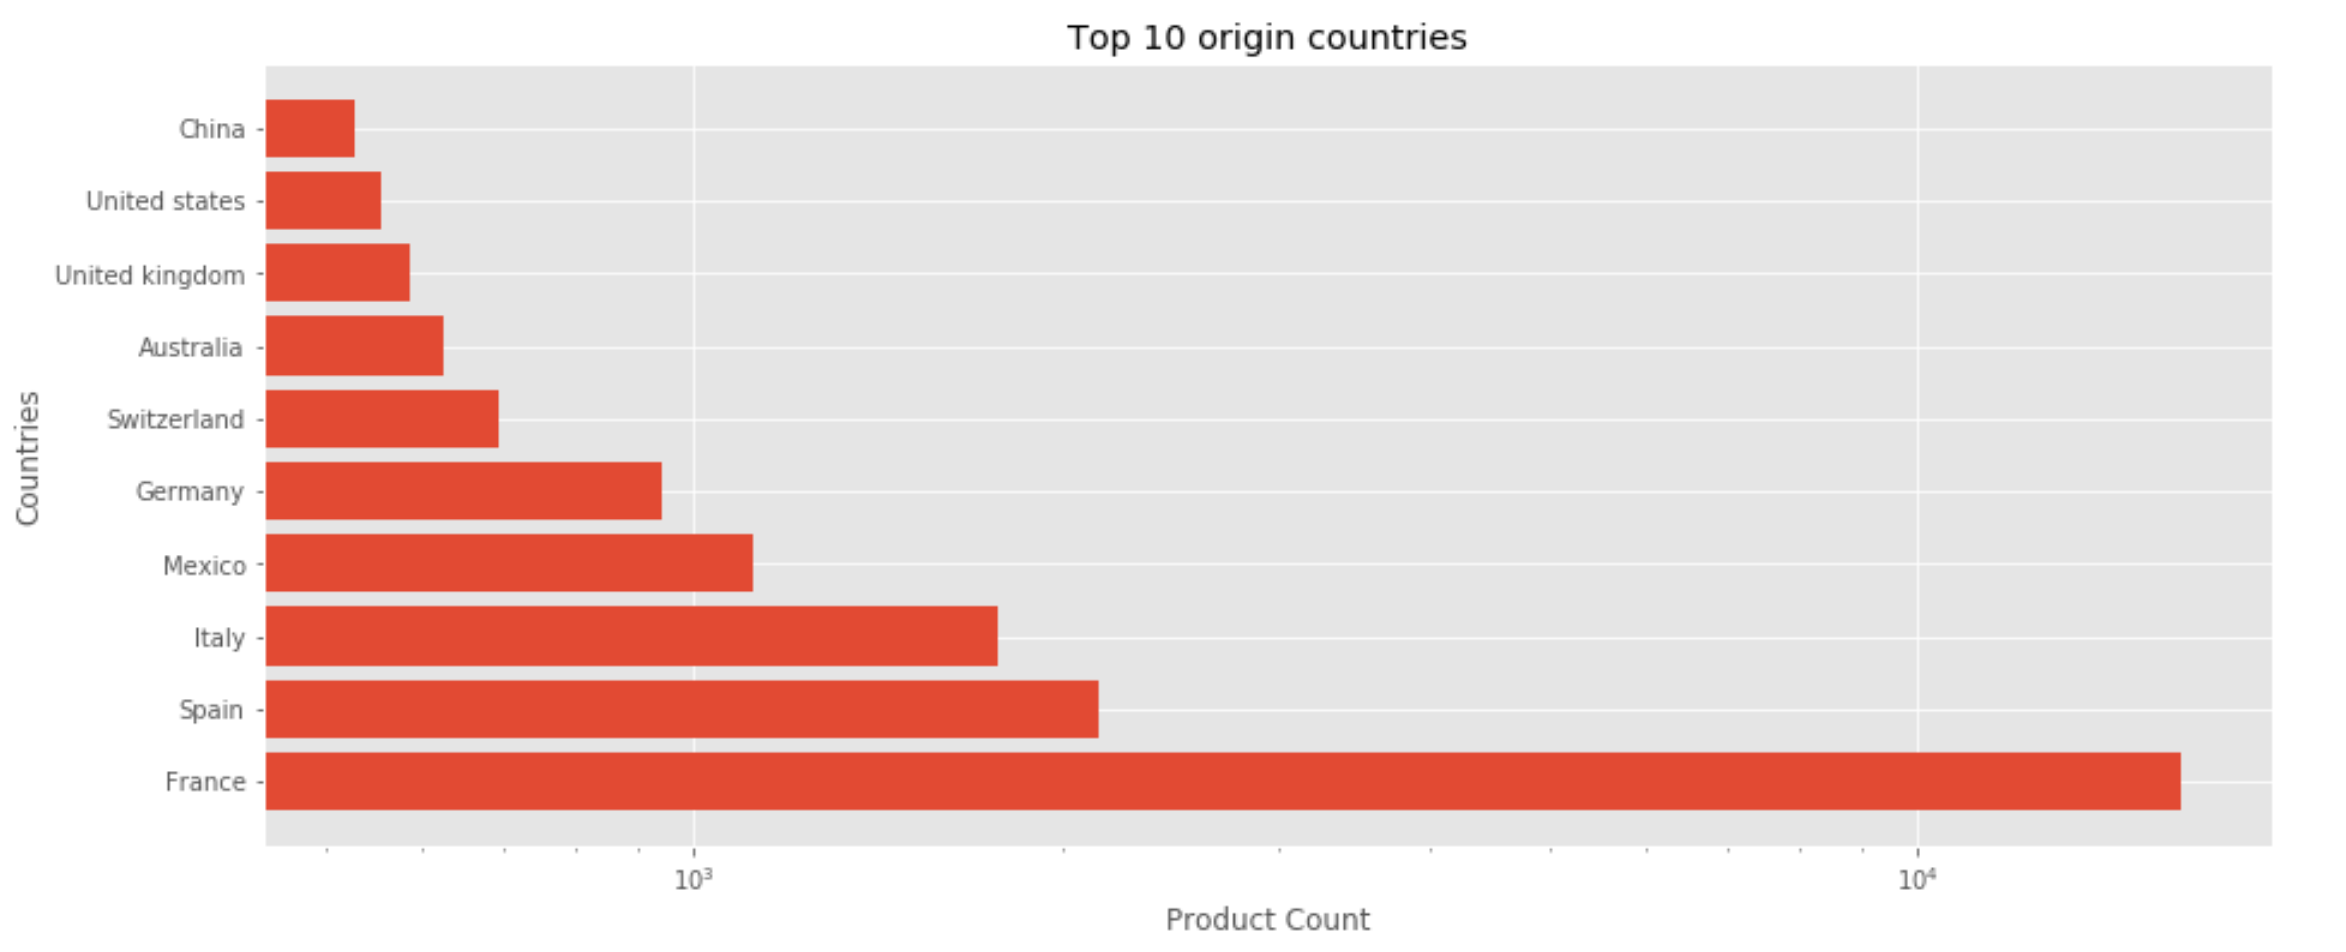
We notice that France is also leading in terms of country of origin, followed by Spain.
Another important aspect of our research is the nutrition score . The dataset provides two types of grading
namely British and French nutrition scores. This data is computed for over 147,000 products and thus does not suffer from a very
large number of missing values. It is computed using the ingredients of the product, mainly based on sugar and vegetables/fruits.
(more details in the next section).
However, a closer look at the dataset showed that these two columns are actually very similar:
Correlation between both nutrition scores
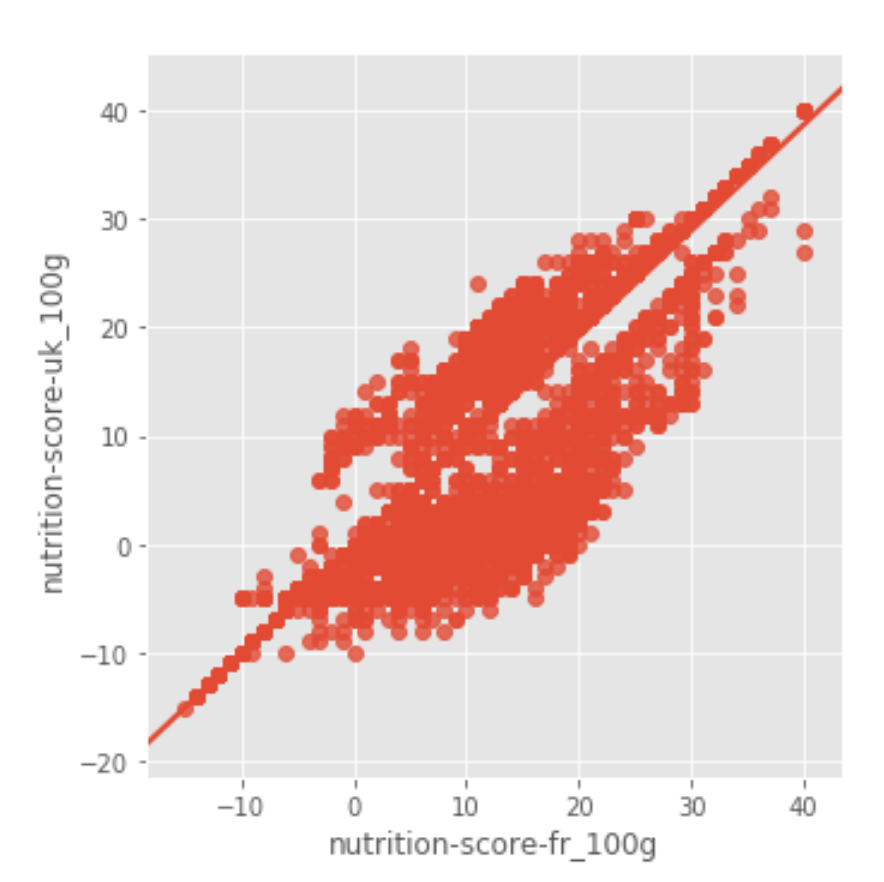
In fact, these two features are 92.8% identical. This does make sense since the way they are computed is very similar.
As a result of this analysis, our research can be centered around only one of the nutrition scores.
Finally, eco-friendliness is one other extremely relevant area we are exploring. There are two features that are related
to this topic, namely carbon footprint and packaging type . Carbon footprint represents the amount of carbon dioxide
released into the atmosphere and the packaging type is simply the packaging in which a given product is sold in.
The following image shows a closer look at both these columns:
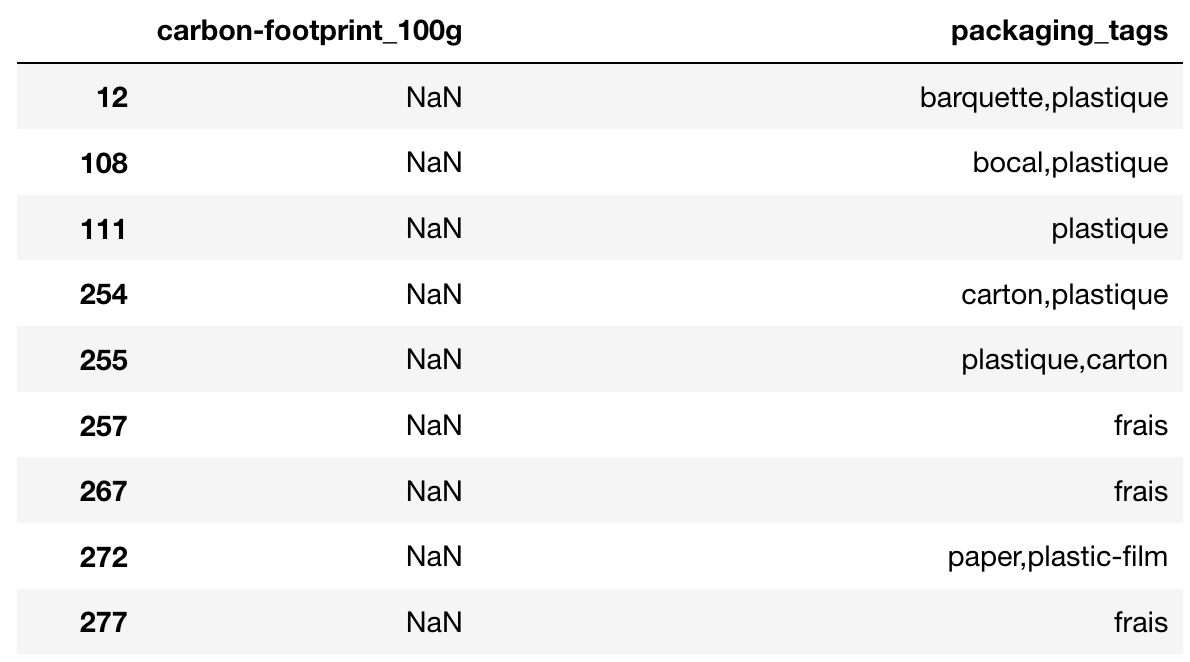
We notice that the carbon footprint column has a large number of NaN values. Unfortunately, our analysis has shown that
this feature has only 342 values out of all of the products, meaning that it cannot be very helpful. On the other hand, the packaging
type is present for more than 130,000 products. Thus, the eco-friendliness topic will be mainly based on the packaging type.
In conclusion for this section, the data exploration and cleaning has shown us that:
After an extensive analysis and cleaning of the provided dataset, we dived into the following question:
What's on my plate?
In order to do so we analyzed the origin of the products, their eco-friendliness, how "healthy" they are and the organic label.
Our research endavors have resulted in interesting findings that will be discussed in this section.
To understand the origin of the products, we have decided to investigate the proportion of importedproducts per country.
This is then used to compute where do the products we eat in a certain country most likely come from. One issue with this topic
is the fact that most products are created/sold in France and the United States, resulting in a certain bias towards those countries.
Therefore, the result can be interpreted mostly as an approximation using the data we have.
We have analyzed the import/export distribution for every country, the following figure show it for the top 6 countries that appear the most in
origins_tags (note that others stands for countries other than the ones listed, with very low proportions):
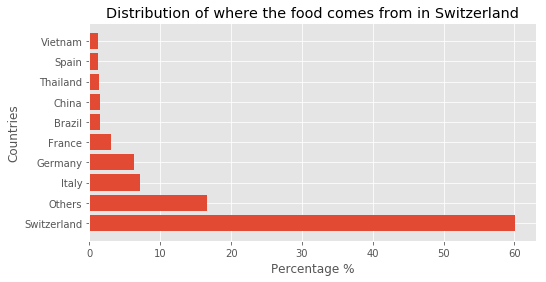
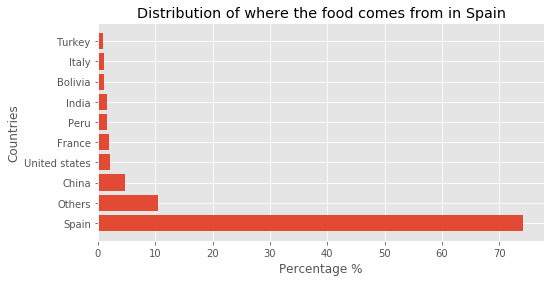
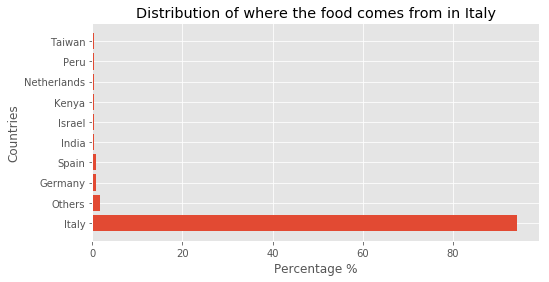
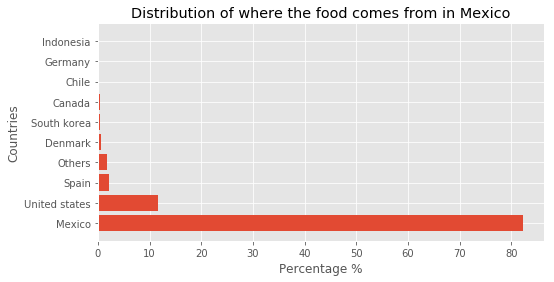
The results show that most products in the dataset are not imported but rather sold in their original country. Furthermore,
we notice that Italy and Mexico import less than 20% of their products, while Germany imports more than 50% of its products.
Switzerland and France have quite similar results, importing around 35-40% of their products.
The following map hows how food is imported across the globe:
Interactive map showing the import/export of products between several countries (zooming helps tracking edges where it is dense)
This analysis presents interesting results and will be used later to see where products mostly come from when we live in a certain country. More specifically, it will be used to show how "international" our plate is.
Product packaging is a complex process. When manufacturers of consumer goods select the types of materials to use in order to package their products,
they are faced with a dilemma. And some of the challenges cannot be solved without sacrificing other elements of the packaging process. For instance, the ideal solution is a light and convenient package for consumer use,
easy to ship and store on the shelves, and eco-friendly . Unfortunately, the usual situation is that a packaging solution can only accomplish two of these goals.
One challenge with answering this research question is quantifying eco-friendliness . Indeed, no research or guidelines
give a specific grade for a certain package on how eco-friendly it is. However, research has been done on which packages
are more eco-friendly than others. Online resources such as [1] give an accurate comparison between the different types of packaging.
The principal types are:
Resources have shown that cardboard and paper are very eco-friendly packaging types, while (non-recyclable) plastic is not. Furthermore, glass is considered as an eco-friendly package, though not as much as cardboard or paper. As a result, we have decided to quantify these types based on comparison with the assumption that plastic is not recyclable, and have given each packaging a certain score, where the higher the grade is the more eco-friendly it is.
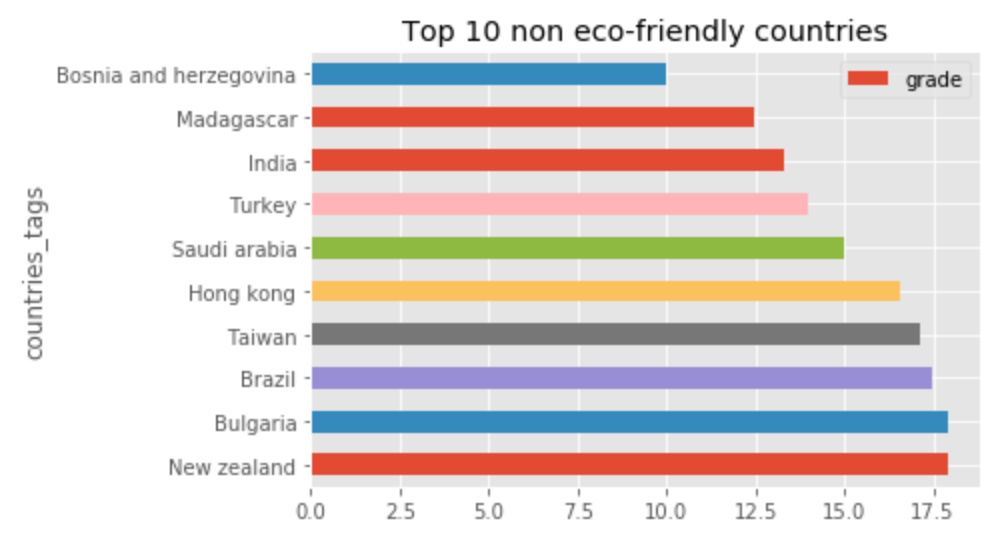
By quantifying them on the basis of comparison, we can have an idea of which countries are the most eco-friendly and who are the least. The results are:
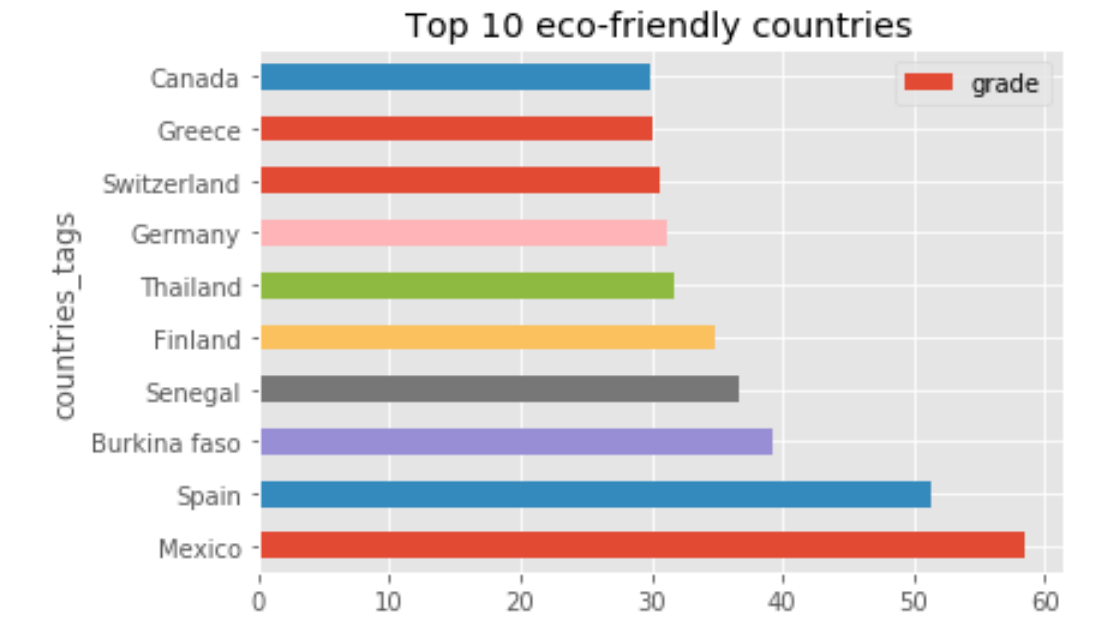
These plots present interesting results: Mexico seems to be a very eco-friendly country in terms of food packaging, followed by Spain.
Mexico has nearly the highest score as an average meaning that it uses mostly cardboard packaging for its products. Of course, this is within the products in the dataset.
It is also interesting to notice that European countries usually rank high in eco-friendliness, while Middle-East/Asian countries typically rank low.
These results will be used later on to see how eco-friendly our plate is.
After an investigation of the eco-friendliness, the organic labels have also been examined. In some sense, organic food is related to healthiness and eco-friendliness, thus fitting in our analysis. In the past years, statistics have shown that organic food is becoming more and more popular. In fact, the organic food market in the US hit $45.2 billion in sales in 2017, while it was only $20.39 billion in 2012 [2].
Some of the most important advantages of organic food include:
An analysis of the organic labels of the products being sold have shown the following results:
Interactive map showing the percentage of organic-labeled products being sold
The map shows us that Georgia, Germany and France rank high in terms of organic-labeled products. Since France has also a very high number of products
in the dataset, then it has a higher level of confidence when compared to Georgia for example (since it has a low number of sold products in the dataset). Thus,
result for France can be interpreted as very similar to the actual situation.
On the other hand, we notice that the United Kingdom, Romania and Australia have a low percentage of organic-labeled products being sold.
This analysis will be used to see how likely is our plate organic.
The nutrition score provided in the dataset establishes a grade for each product depending on the amount of
energy, sugar, fat, sodium on one hand and vegetables, nuts, fruits on the other. This score is computed
in certain way the lower the score is, the more the product contains healthy ingredients and less unhealthy ingredients.
In a sense, this score represents how healthy a product is. Details on how it is calculated is shown in [3].
In the aim of computing how "healthy" our plate is, we have computed the average nutrition score per country.
As stated earlier, since the French and British nutrition score are very similar (92.8%, same number of products), we have
arbitrarily decided to only use the British score as a reference. However, the French nutrition score could have also been used.
Moreover, we have analyzed only the countries that have at least 10 products containing the nutrition score data in the dataset.
This was done to avoid ranking countries which have only one or two healthy products and would thus appear to be very healthy countries without sufficient data.
A map of the result is shown below, keeping in mind that the higher the score is, the less healthy it becomes:
Interactive map showing the nutrition score for the countries that have at least 10 products with the nutrition score
We notice that India and Denmark have the highest nutrition score and thus the less healthy products in the dataset.
On the other hand, Netherlands and Georgia have the healthiest products in the dataset. Switzerland, Spain and the UK have also
more or less healthy products.
This analysis will be used to quantify healthiness in the final question:
This question uses the different answers we have provided earlier. After investigating these characteristics, we propose showing (probabilistic) information depending on the country we live in. The information is split into five categories:
The result is summarized below for several selected countries:
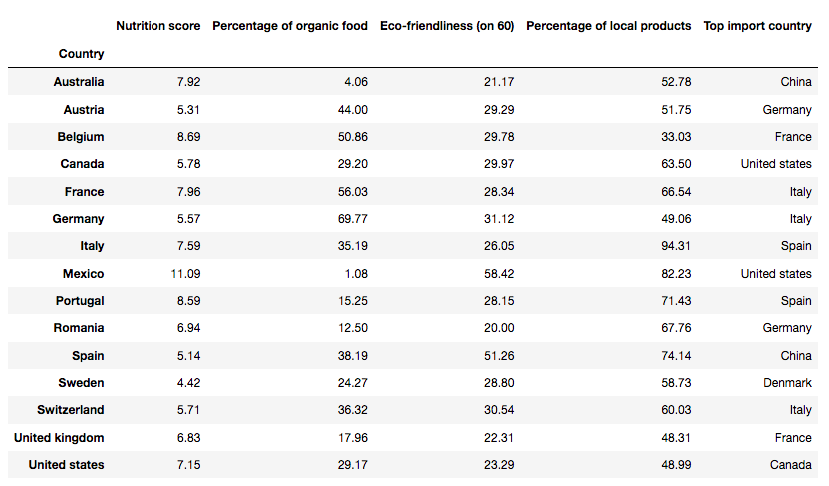
This table provides a summary of our research, which can be extended to more characteristics such as the "Top export country" or even
an analysis of the ingredients. Unfortunately, the dataset contains a large number of missing values and thus this table is only approximative.
Another way of presenting it would have been to allow the user to manually select the desired country, but we thought this brings all our research together
in a better way.
We hope this helps you gain insights into interesting data about what is on your or your family's plate,
and we are happy to be the ones providing it.
[1] Biodegradable and Recyclable Packaging Material: - Kate Pullen
https://greenliving.lovetoknow.com/Biodegradable_and_Recyclable_Packaging_Material
[2] Sales growth of organic foods slips to 6.4% in 2017 - Jeff Gelski (2018): https://www.foodbusinessnews.net/articles/11853-sales-growth-of-organic-foods-slips-to-64-in-2017
[3] British nutrition score - The UK Ofcom Nutrient Profiling Model (page 6 and 7): https://www.ndph.ox.ac.uk/cpnp/files/about/uk-ofcom-nutrient-profile-model.pdf